Introduction
The term “lagging indicator” refers to a certain kind of indicator that is frequently utilized. In this post, we will discuss what lagging indicators are and how they can be useful when analyzing market trends. Additionally, we will look at several examples of lagging indicators.
Investing in the stock market needs careful consideration of a wide range of factors, each of which has the potential to influence the operation of a company and the price of its shares. In order to make judgments based on accurate information, traders and investors rely on a diverse set of indicators.
Indicators known as lagging indicators, which are also known as trend-following indicators, are instruments that are used to analyze historical price movements and establish the general trend of the market.
Lagging indicators provide confirmation of price trends that have already been established, as opposed to leading indicators, which seek to forecast future price movements. These indicators are drawn from data in the past and reflect shifts that have already taken place in the market.
The historical price trends have a tendency to replicate themselves, which is the reasoning behind the utilization of lagging indicators. Investors can acquire insight into how the market has behaved in situations similar to their own by examining historical trends.
The overall direction of the market can be determined with the assistance of lagging indicators, which also indicate the strength of an existing trend.
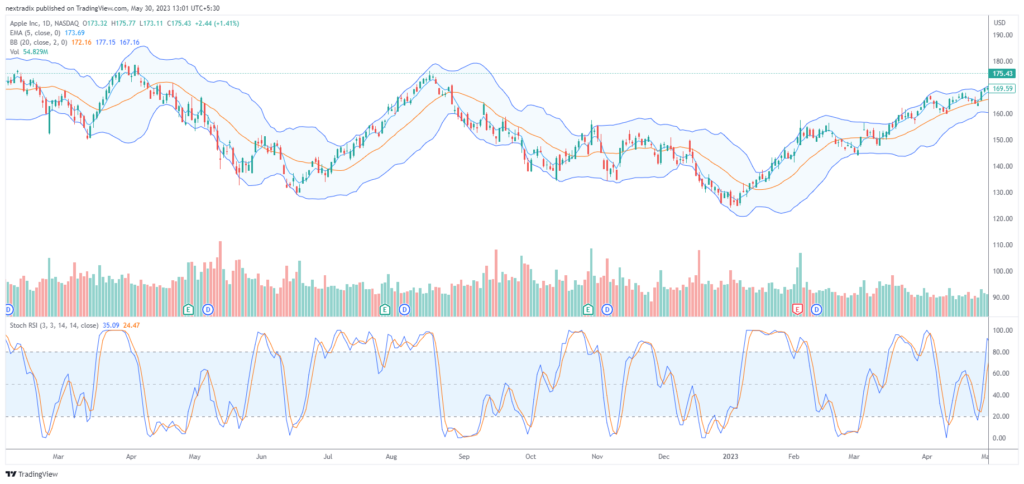
Moving averages, the relative strength index (RSI), the moving average convergence divergence (MACD), and Bollinger Bands are all examples of indicators that are considered to be lagging. Let’s give each of these indicators a more in-depth look, shall we?
Moving averages
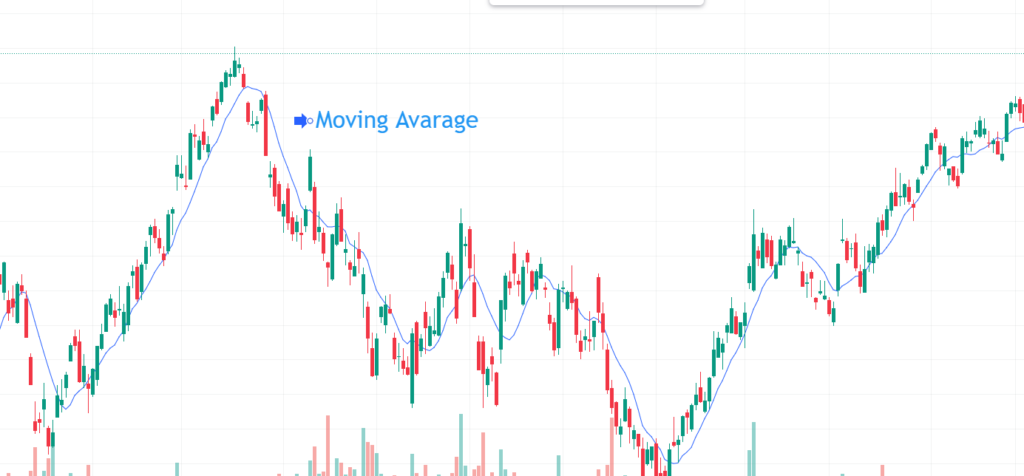
Moving averages are determined by taking the average price of an asset over a predetermined amount of time and calculating the result. They make the price variations easier to understand and provide a graphical picture of the trend.
The moving averages of 50 days and 200 days are the ones that are utilized the vast majority of the time. It is seen as a bullish signal and an indication of an upward trend when the moving average that covers a shorter time period crosses above the moving average that covers a longer time period.
On the other hand, when the moving average that is shorter in time crosses below the moving average that is longer in time, this is interpreted as a bearish signal and indicates that there is a downward trend.
The relative strength indicator (RSI)

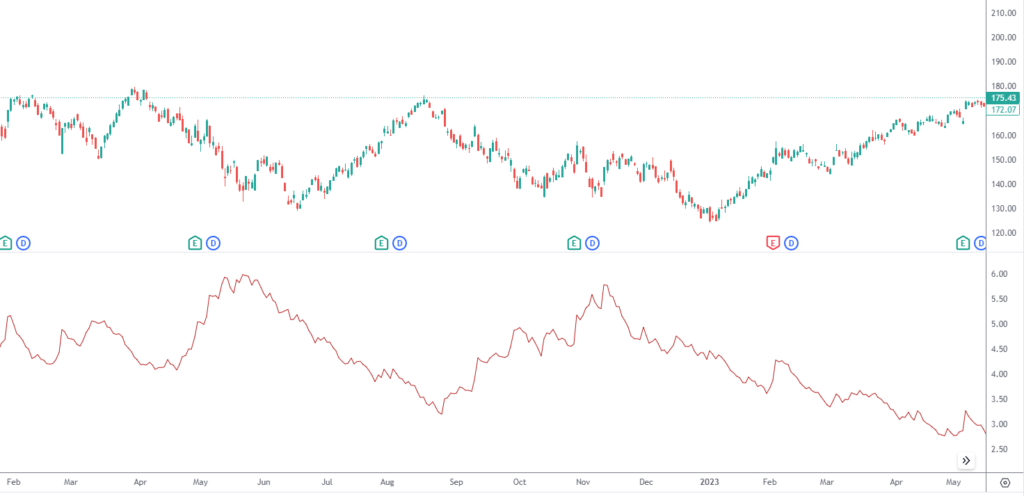
The Relative Strength Index (RSI) is a momentum oscillator that assesses the rate of change as well as the rapidity of price movements. When determining whether a stock is overbought or oversold, it does this by comparing the magnitude of recent gains to the magnitude of recent losses.
Take your financial future in your own hands! Sign up for MoneyMunkx today and gain access to exclusive tips, tricks, and insights into the world of finance, stocks, and cryptocurrency!
Readings above 70 on the RSI show that overbought conditions are present, whereas readings below 30 suggest that oversold conditions are present. The RSI goes from 0 to 100.
When the RSI goes above 70, it may be a signal that the stock is overdue for a correction; but, when it goes below 30, it may be an indication that there may be a potential purchasing opportunity.
Moving average convergence divergence (MACD)

The Moving Average Convergence/Divergence (MACD) indicator is a trend-following momentum indicator that illustrates the connection between two different moving averages of a security’s price.
A histogram is included in addition to the MACD line and the signal line that is found on it. A bullish signal is generated whenever the MACD line crosses above the signal line; this indicates that there is potential for an upward trend.
When the MACD line does the opposite and crosses below the signal line, a bearish signal is generated, which indicates that a prospective downward trend may be developing.
Bollinger Bands
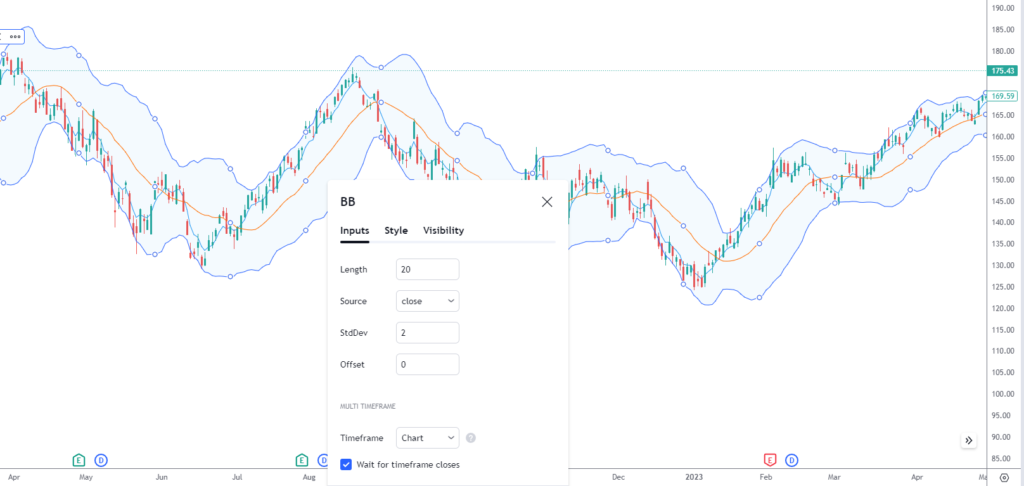
The Bollinger Bands are two bands of varying volatility that are superimposed on top of and underneath a moving average. They grow and shrink in proportion to the degree to which the price of the stock is volatile.
When the price travels closer to the upper band, it is seen to have reached an overbought condition, and when it moves closer to the lower band, it is deemed to have reached an oversold condition.
Bollinger Bands are a technical indicator that can be utilized to determine when a period of low volatility is likely to be followed by a large price change.
It is vital to keep in mind that lagging indicators have some limitations, despite the fact that they are helpful instruments for analyzing prior trends and validating market movements.
Average True Range (ATR)
The ATR is a measure of volatility that computes the average difference between the highest and lowest prices over a given time period. It reveals how much a stock typically fluctuates over a particular time period.
ATR is utilized by traders to measure volatility and validate the strength of a trend. Higher ATR values indicate increased volatility, whereas lower values indicate decreased volatility.
Average Directional Index (ADX)
The ADX is a lagging indicator that assesses a trend’s strength. It indicates the strength of the trend rather than its direction. A rising ADX indicates a strong trend, whereas a declining ADX indicates a trend that is weakening.
Traders frequently employ the ADX in conjunction with other indicators to corroborate the presence and strength of a trend.
On-Balance Volume (OBV)
OBV is a volume-based lagging indicator that monitors the stock’s cumulative purchasing and selling pressure. It adds volume on days of growth and subtracts volume on days of decline.
The concept underlying OBV is that volume frequently precedes price fluctuations. An increase in OBV indicates increased purchasing pressure and a potential upward trend, whereas a decrease indicates increased selling pressure and a potential downward trend.
Stochastic Oscillator
The Stochastic Oscillator is a well-known lagging indicator that compares the closing price of a security to its price range over a particular period. There are two lines: %K and %D.
The %K line indicates the current closing price relative to the range, while the %D line is a moving average of the %K line. The oscillator ranges from 0 to 100, with values greater than 80 indicating overbought conditions and values less than 20 indicating oversold conditions.
Stop-and-reverse paraboloidal SAR (Stop and Reverse)
The Parabolic SAR is a trend-following indicator that assists in identifying potential price reversals. It appears as a series of dots either above or below the price chart.
When the dots are below the price, it indicates an upward trend, whereas when they are above the price, it indicates a downward trend. When a trend reversal occurs, the dots of the Parabolic SAR change positions, providing a signal to traders.
Ichimoku Cloud
The Ichimoku Cloud is a comprehensive lagging indicator that depicts support and resistance levels, trend direction, and momentum visually. It includes the Kumo (cloud), the Tenkan-sen (rapid line), the Kijun-sen (baseline), and the Chikou Span (lagging line).
Traders analyze the interaction between these factors to determine the market’s overall trend.
Disadvantages of Lagging indicators
Lagging indicators are reactive in nature, which means that they provide signs after a trend has already begun. This is because they are based on the assumption that the trend will continue. During times of market volatility or reversals in trend, they may also produce erroneous signals.
In order for investors to acquire a complete comprehension of the stock market, it is essential for them to make use of lagging indicators in conjunction with other instruments of technical analysis as well as fundamental analysis.
Investors can improve their decision-making process and increase the likelihood of successful transactions by taking both lagging and leading indicators into account.
When it comes to conducting research on the stock market, investors rely on a wide range of indicators in order to arrive at well-informed judgments. It is crucial to be aware of the limitations of lagging indicators despite the fact that they can corroborate market trends and have their purposes in doing so.
Delayed signals
Lagging indicators have a number of significant problems, one of which is that they only present signals once a trend has already begun, which is one of the most significant disadvantages of lagging indicators.
The name of these indicators gives away the fact that they are behind the real movement of the market. When a lagging indicator finally confirms a trend, it’s possible that a sizeable amount of the price move has already transpired by that point.
Because of this delay, chances may be lost, and late entrances or exits may be made from positions.
Limited Predictive Power
In contrast to leading indicators, which attempt to forecast how prices will move in the future, lagging indicators primarily serve to confirm trends that have already occurred.
By definition, they concentrate on the past and make their predictions based on previous price levels. As a consequence of this, it is possible that they are not effective at predicting sudden changes or reversals in trends.
If a lagging indicator takes too long to provide a reversal signal, it may be too late to capitalize on the new trend by the time it does so.
Vulnerability to False Signals
Lagging indicators are more prone to erroneous signals, particularly during periods of market volatility or signal reversals. The presence of numerous crossovers and contradicting signals in the market as a result of conditions that are volatile can lead to confusion and, as a result, potentially poor trading decisions.
If you make your judgments about market direction based purely on lagging indicators without taking into account any other aspects, you run the increased danger of making incorrect assumptions.
Lack of Contextual Information
Lagging indicators are those that only pay attention to price changes and past data, frequently ignoring other important backgrounds. Stock prices are susceptible to being significantly influenced by a wide variety of factors, including market news, corporate fundamentals, macroeconomic trends, and geopolitical events.
If you only rely on lagging indicators, you run the risk of missing important information that could have an impact on how the stock will perform in the future.
Insufficient for Trading in the Short-Term
For long-term investors who want to capture the overall market trend, lagging indicators are more appropriate. Lagging indicators, on the other hand, might not be as useful for traders who focus on the short term and rely on rapid price changes and volatility.
n order to recognize opportunities in the market that will only last for a limited amount of time, traders who engage in short-term trading frequently demand indicators that are more sensitive and dynamic. Examples of such indicators are oscillators and leading indicators.
Conclusion
In conclusion, lagging indicators play a vital role in evaluating market trends and validating the strength of established trends. This is because lagging indicators collect data after market trends have already been established.
These indicators, which are produced from historical price data, provide useful insights into the behavior of the market in the past by shedding light on it.
When it comes to making choices regarding the purchase or sale of stocks, investors’ choices can be improved by using lagging indicators in conjunction with other methods of stock analysis.
However, it is vital to understand the limitations of these indicators and to use them in conjunction with other tools for a complete and comprehensive study of the stock market.
Our devoted team of financial experts and seasoned writers work tirelessly to curate content that is both instructive and easy to understand. We cover a wide range of topics, including blockchain technology principles, analyzing different cryptocurrencies, decoding market trends, and investigating investing techniques.
- AGE CALCULATOR - July 21, 2024
- PAY YOUR CAR LOAN WITHOUT INTEREST – USE THIS TRICK - July 21, 2024
- Mutual funds returns calculator - January 2, 2024